News Roundup: Small Caps Doing Well, Insiders Sell, Debt, S&P 500 Equal Weight, Robinhood Clients are Bad Investors
Small Caps Coming Back?
I haven’t beaten this drum for a while, but starting last winter, I (and many others) started questioning whether, once the small-cap-bludgeoning high interest rates started coming down, small caps would start to perform better.
It seems so.
Charlie Bilello has shown what’s a pretty amazing performance differential between small-cap value stocks (as measured by the Vanguard ETF that tracks them) and the Russell 1000 Growth Index – which Charlie bills as “large cap,” but which I’d say is likely small and mid-cap owing to that fact that even the S&P 500 has a lot of mid caps. There actually aren’t as many large-cap stocks in the world as one might think.
Anyway, for the past three months (roughly), small cap value has lapped the Russell 1000 by 13.3 percentage points.
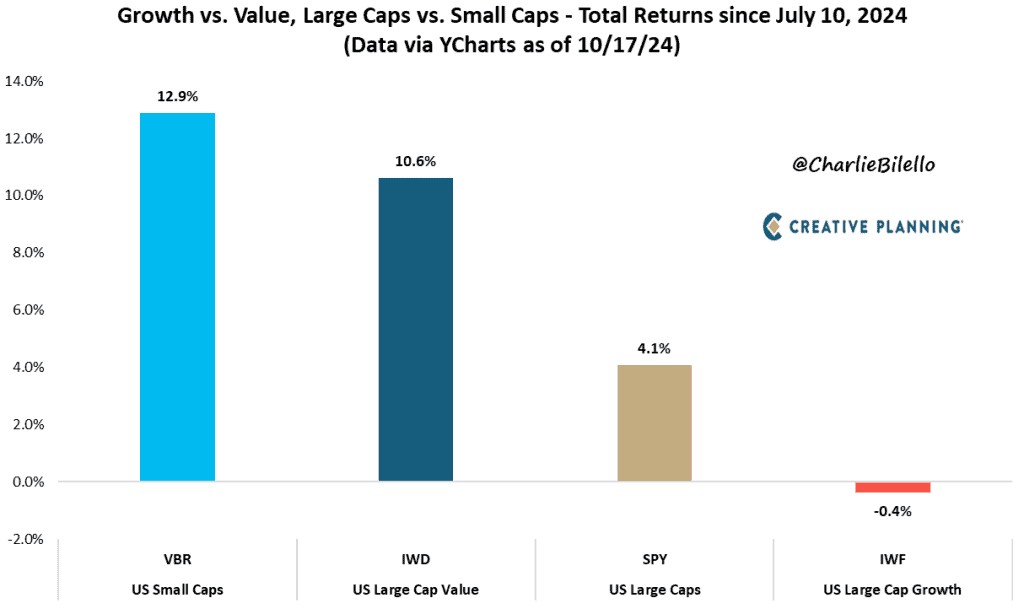
The big question is: Will it continue? Predictions are hard to make, but we’re at the beginning of an interest rate easing cycle, so that’s at least one catalyst in favor of “yes.” If the US were to go into a recession, small caps would presumably be hit the hardest (small caps sell more domestically than large caps, and also have both a lot more debt and a much higher proportion of floating-rate debt).
Americans Keep Spending
I joked to a reporter the other day that one of the most stable charts in the US economy is the chart of consumer spending:
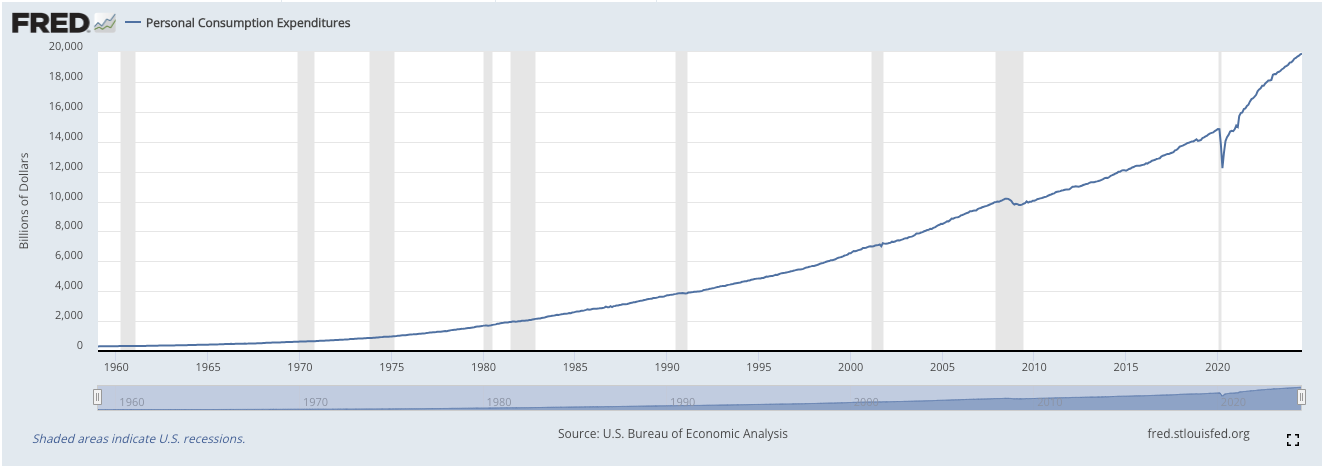
The above chart is of personal consumption expenditures (PCE) – durable and nondurable goods, mostly – which makes up ⅔ of US domestic spending.
You’d expect much of Americans’ spending to be fairly consistent (though I’d be curious to see this compared to a chart for developing economies), because many of the things we buy, we can’t easily stop buying. But it’s also surprising how willing Americans are to reach for their credit cards:
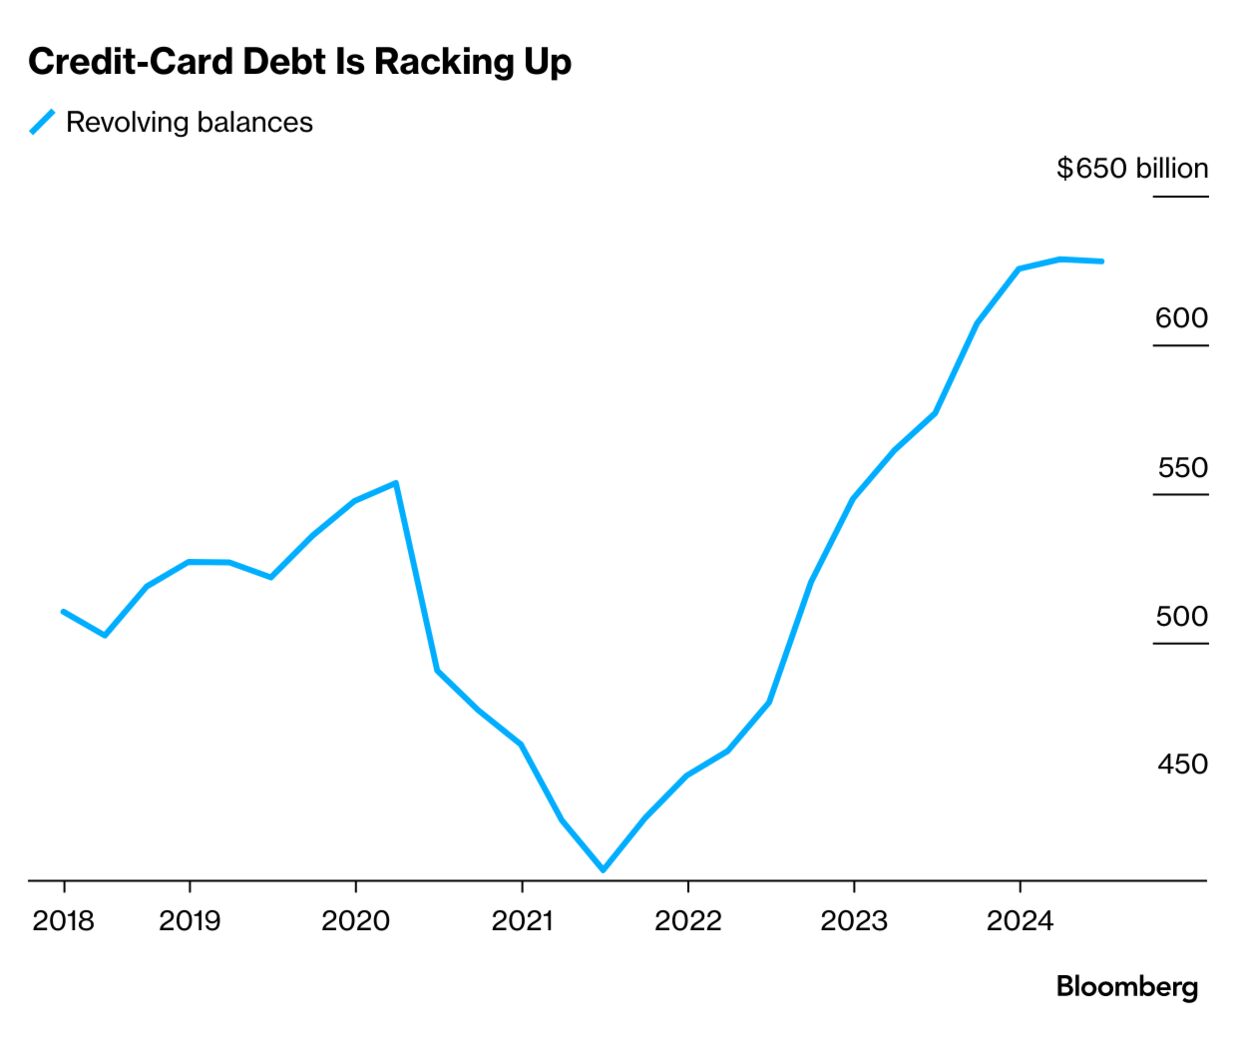
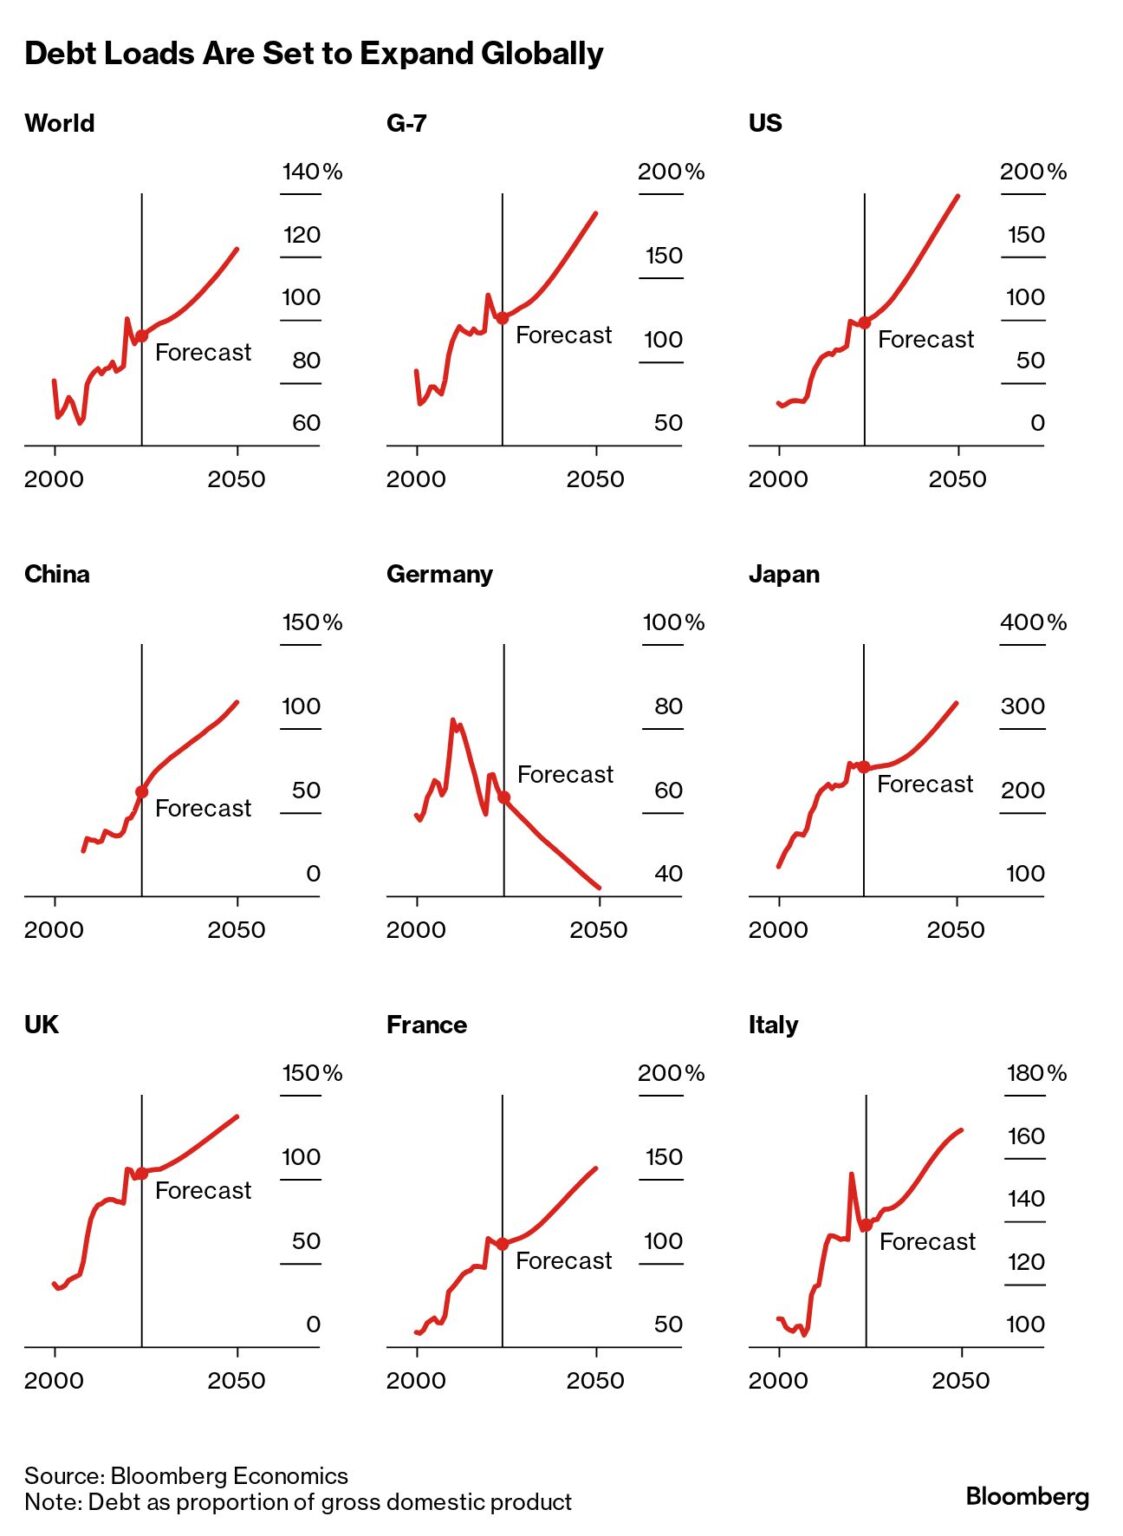
And it’s not just Americans who seem to love debt these days: It’s entire countries. Bloomberg has a great graphic showing debt to GDP predictions for the world’s major economies (the “to GDP” is important because world economies tend to expand over time, and it wouldn’t be surprising for debt to expand in lockstep; predictions are, though, that debt will not expand in lockstep).
What does this mean? Really, nobody knows. A “debt doomsday” scenario is one situation. Or the forecast may just be wrong. One wonders, though: If “all” the big economies are issuing tremendously more debt, who’s buying it?
Robinhood: Our Investors Underperform
Actually, that title is a cheap shot. I’ll explain why.
Robinhood did start the Robinhood Investor Index a few years ago, which tracks the 100 most-held positions by Robinhood investors. First of all, good for them.
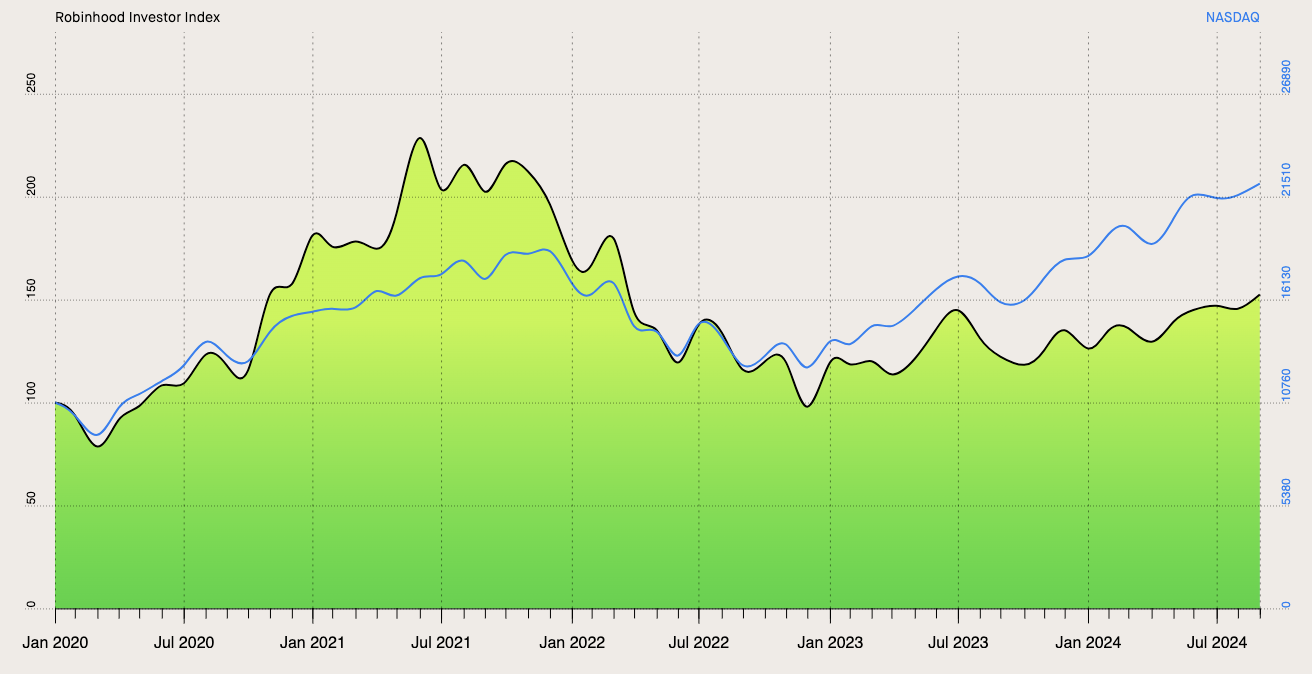
Robinhood seems to explain only the concept of its index, and not its exact computation, but we know that it’s weighted not by raw assets in stocks but instead by relative weight of stocks in client portfolios: Presumably an account with $1,000 that has $600 allocated into GameStop (Nasdaq: $GME) would contribute a bigger weighting to GameStop’s ranking in the Robinhood index than a $10,000,000 account with, say, $600,000 allocated to GameStop.
In other words, if I’m understanding its computation correctly, the Robinhood index could be perceived as rewarding any of:
- Conviction
- Ignorance of the importance of diversification
- Ideological belief that extreme stock selection skill should be matched with extreme portfolio concentration, which is largely similar to the “conviction” logic.
If you read my BBAE Blog post about diversification, you know the conviction-vs.-diversification debate.
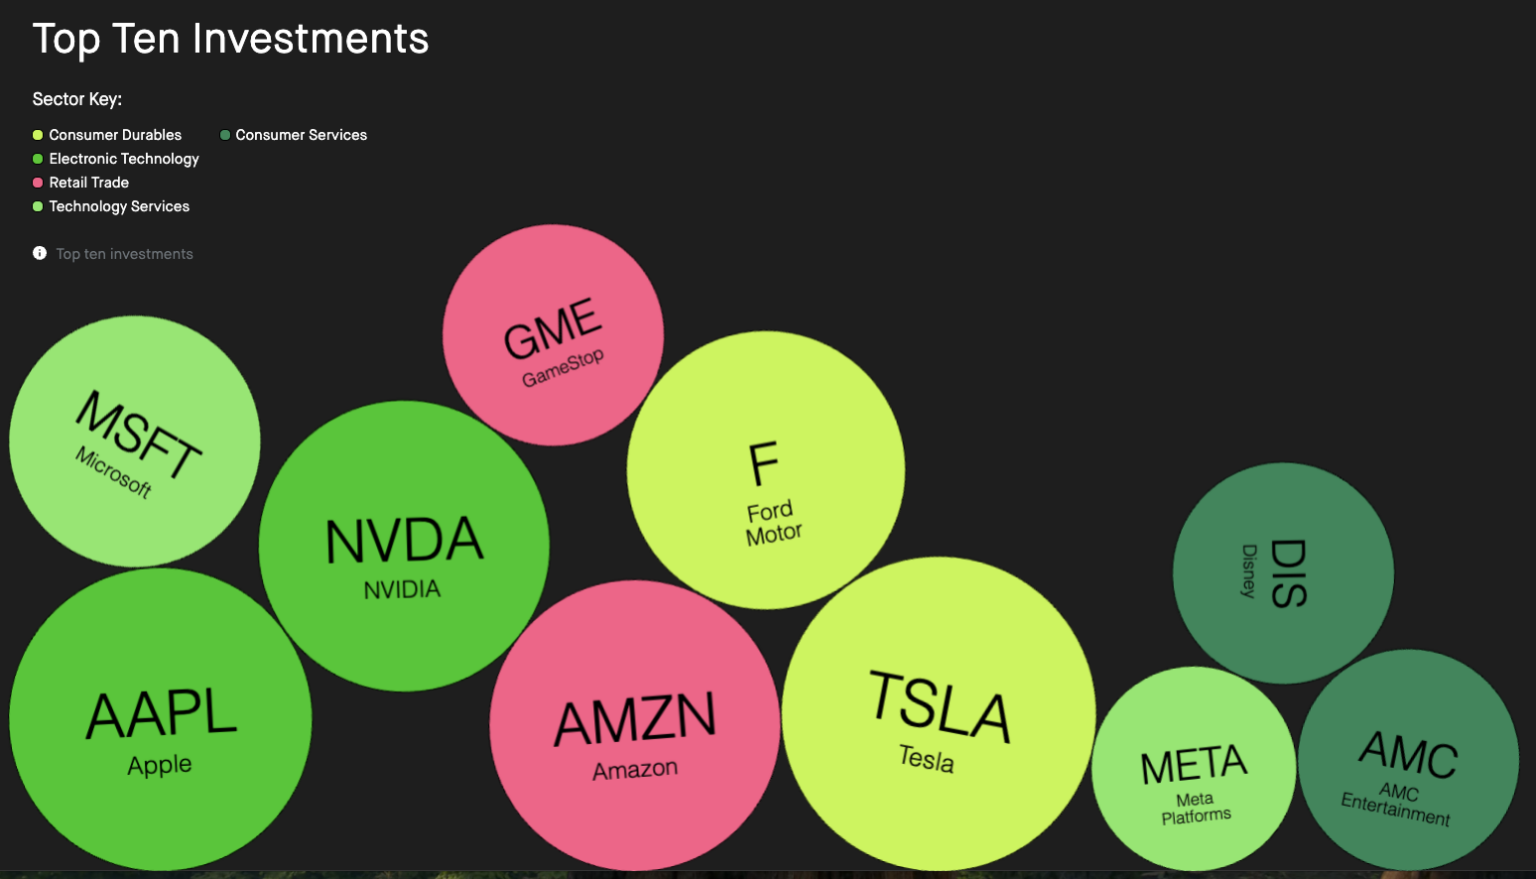
GameStop is, indeed, one of Robinhood’s top 10 “most confidently held” stocks, so I’d be hesitant to choose the “extreme stock selection skill” explanation.
The negative way to look at it is that this index seems to reflect the holdings of Robinhood’s least-well-balanced portfolios – which likely skew small (to be fair, if you have, say, a $1,000 portfolio and buy individual stocks instead of ETFs while your portfolio is still small, it’s mathematically harder to be diversified than if you have a $1,000 portfolio) and are likely owned by less experienced speculators.
The more positive way to look at this is that as a group, “all” individual investors underperform (not literally all, but as a group, they do), and have done so for decades, as has been documented by academic literature. And we should not be wildly surprised that Millennial-age and older Gen Z investors are buying the stocks they hear the most about on social media. And while their stock picking abilities have lagged the Nasdaq, they haven’t lagged wildly, at least not yet (I’d be curious to see the results with Nvidia removed from both the Nasdaq and the Robinhood index).
So, Robinhood investors underperform, or Robinhood investors are just like any other. Take your pick.
Corporate Insiders Selling
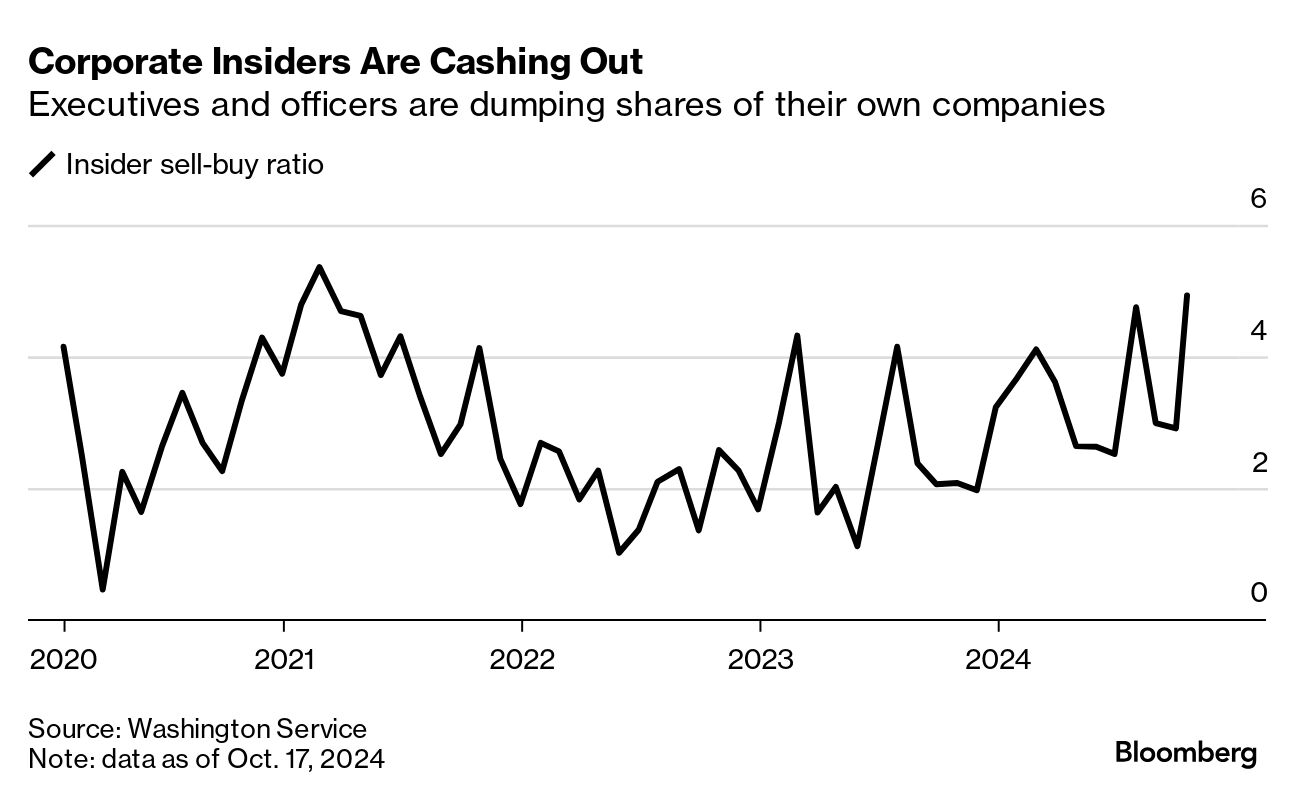
If Robinhood’s unsophisticated retail investors are buying the wrong stuff, some of the investors who, according to academic research, know the best are bailing out.
Research has shown that insiders can outperform the market by as much as 11 percentage points per year, so I pay attention when they sell more. That said, from the Bloomberg graphic below, insider selling seems like a herky-jerky kind of thing, so I’m not panicking to see it moderately higher.
Will the S&P 500 Equal Weight Catch Up?
A quickie. With small caps back in the fast lane – and larger caps slowing down – one anomaly that should reverse is the outperformance of the “regular” S&P 500 index, which is weighted by market cap, relative to the equal-weight S&P 500. I was reminded of this by another unsolicited email by Bespoke Investment Group which, perhaps per their plan, I could not resist the temptation to cite.
Recently, with the Magnificent 7 and general domination of mega caps, the regular S&P 500 had started to pull ahead:
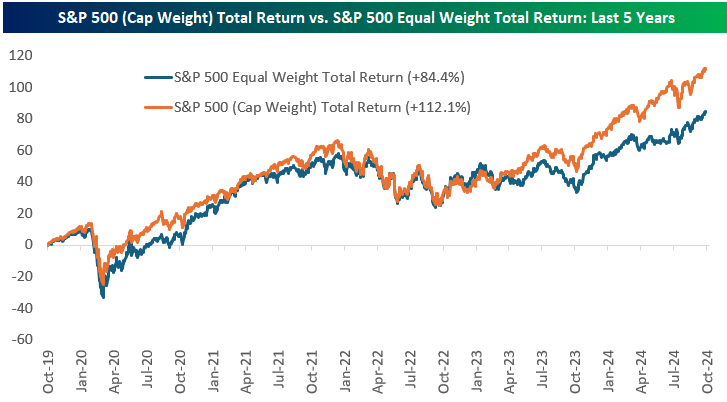
But this is not the normal way of the universe, or at least is not the normal way the universe has been. See this chart from 1990 to present showing a clear outperformance of equal weight.
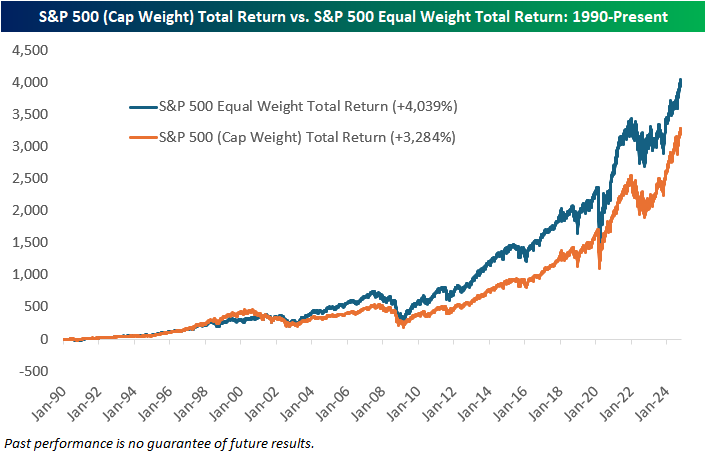
I’ve talked about this before. BBAE has three special (and exclusive) portfolios from our friends at MarketGrader. MarketGrader’s smart beta methodology is more complex than simply equally weighting stocks (it uses 24 factors), but with a more egalitarian market, in terms of factors that move stocks, I’d wager there’s a chance that we’re entering a market where a more robust set of factors – including smaller market size – will perform better.
This article is for informational purposes only and is neither investment advice nor a solicitation to buy or sell securities. All investment involves inherent risks, including the total loss of principal, and past performance is not a guarantee of future results. Always conduct thorough research or consult with a financial expert before making any investment decisions. Neither the author nor BBAE has a position in any investment mentioned.


