The Piotroski Score and You
Some 20 years ago, when TV psychologist Dr. Phil was selling his Shape Up! weight loss supplements, he appeared – if my memory serves me – in an ad with a slogan that read something like: “There is no magic pill for weight loss.”
Without commenting on Dr. Phil’s weight-loss expertise (his products met with criticism and resulted in a $10.5 million settlement), his “no magic pill” comment was fully correct then, and is still mostly correct now, even if there is arguably a magic “pill” in the form of GLP-1 agonist injections like Ozempic, Mounjara, and Wegovy.

Image source: Behance.net
No magic pill in investing – but is 23% per year close?
If the investing industry has a parallel to the diet industry’s magic pill, it would be a magic formula that an investor can mindlessly follow to beat the market while taking all the guesswork and ambiguity out of investing.
There is no magic formula for investing. Because investing is a social science, there never will be. But some researchers have arguably come close to creating Ozempic for investors.
A particularly fascinating strategy is the Piotroski Score, which Stanford Accounting professor Joseph Piotroski debuted in this 2000 paper (Piotroski, 2000) when he was at the University of Chicago.
Piotroski examined stock returns from 1976-1996 and found that by ranking stocks on a simple set of nine criteria, and then going long (buying) the best and short selling the worst, his “Piotroski Score” strategy would have delivered 23% per year.
What is the Piotroski Score?
The Piotroski Score is simple, calculation-wise.
It’s an F-score model that just applies a binary “yes/no” (technically, 0/1) framework to nine criteria, and sums the results.
- Is return on assets (ROA) positive? (1 if yes, 0 if no)
- Is operating cash flow (OCF) positive? (1 if yes, 0 if no)
- Is current-year ROA > last year’s ROA? (1 if yes, 0 if no)
- Is OCF/total assets > ROA? (1 if yes, 0 if no)
- Did the long-term leverage ratio decrease relative to last year? (1 if yes, 0 if no)
- Did the current ratio increase relative to last year? (1 if yes, 0 if no)
- Were no new shares issued this year? (1 if yes, 0 if no)
- Did gross margin increase this year? (1 if yes, 0 if no)
- Did asset turnover increase this year? 1 if yes, 0 if no)
Companies that score an 8 or a 9 are considered strong, and those scoring 1 or 2 are weak.
Piotroski Score rationale
Joseph Piotroski is an accounting researcher. Both accounting and finance researchers study capital markets, but accounting researchers unsurprisingly focus more on financial statement analysis – which as Piotroski himself notes in his paper, predisposes a bit of a value bias. (Growth firms tend to move more based on future projections than here-and-now numbers.) But Piotroski’s idea is to use accounting measures to get a “read” on a firm’s health through profitability, leverage/liquidity, and operational efficiency lenses.
Does the Piotroski Score still work today?
This is a highly contested question, believe it or not.
First, though, if you’re new to “mechanical” investing (which is basically a simpler cousin of the more mathy quantitative investing), note that the Piotroski Score, like most rules-based mechanical investing screens, looks only at a handful of numbers, and mostly from the most recent year. It makes no attempt to forecast. It ignores management. It ignores macroeconomics, competition, regulatory considerations, technological developments, and many other things a professional fundamental analyst would customarily research when building an understanding of a company.
While critics will say mechanical methodologies fail to include many factors capable of moving stock prices, proponents say that’s the point – or at least that the collateral damage is worth the benefit of the simplicity.
On the Piotroski Score itself, the most obvious thing to note, per above, is that it’s essentially a value screen, and there are years – in fact, there are multi-year periods like the ultra-low-rate period from 2009 until 2022 – in which value has performed poorly relative to growth.
That said, Jan Hendrik Markus Mohr seems to have applied the Piotroski Score to growth stocks and found that a long/short strategy applied to European stocks could have conceivably resulted in market outperformance of nearly 25 percentage points in an average year from 1999-2010.
If truly realizable, a 25 percentage point outperformance would grow one’s wealth very quickly.
Yet Yuval Taylor penned a fairly aggressive critique of the Piotroski Score on SeekingAlpha, claiming that it no longer beats the market. He notes that we don’t know whether Piotroski just pulled his nine criteria out of a hat, or data mined until finding some that seemed to work. And by concluding his study period with 1996 data, Piotroski stopped just before the tech bubble, during which the market shifted to favoring growth stocks (although if Jan’s results apply to US stocks as well, this may not be a limitation).
Yuval notes that while profitability criteria make sense, book value is more murky. He has a point. Book value is a staple of academic studies, yet accounting book value is a fairly inaccurate measure of true company value due to certain accounting distortions (for example, Coca-Cola’s brand is likely it’s biggest source of value, yet its brand value is nowhere in it financial statements because it was built up over the years instead of being acquired in a transaction).
Financial firms are the exception because of mark-to-market accounting, but their “issue” is having a blurry line between what’s a liability and what’s inventory (debt is arguably a bit like inventory for a bank), and the Piotroski Score effectively penalizes them for this.
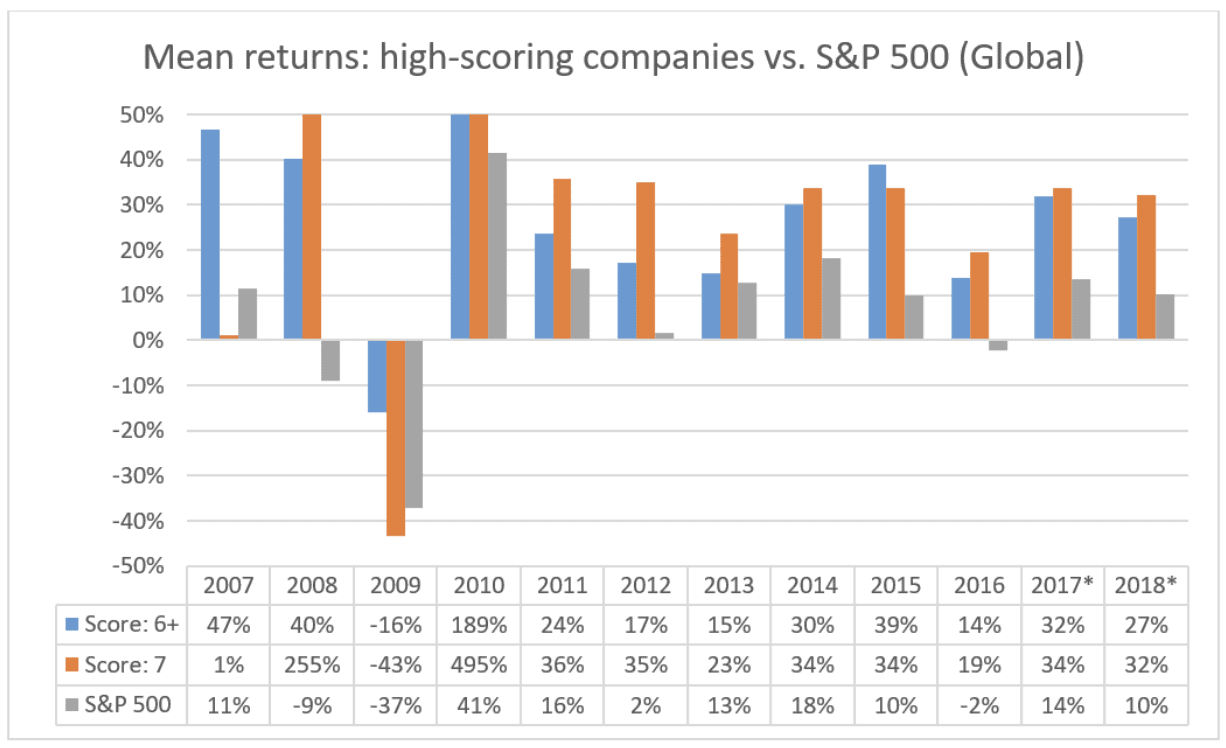
Anyway, the Piotroski Score has other critics as well as other proponents (not in English, but shows a pretty massive outperformance). And there are plenty of modifications of the Piotroski score, including this one by Mikhail Subbotin of Alpha Architect who shows that his modification – in which a 6 or 7 score is the equivalent of an 8 or 9 on the original Piotroski Score – appears to beat the market strongly.

Image source: AlphaArchitecht.com
Should you invest based on the Piotroski Score?
This is probably like asking: does value investing work? In some years, and in some markets, value investing absolutely works. In fact, a preponderance of academic evidence shows that it outperforms growth over time (Lakonishok, Schleifer, and Vishny, 1994 is probably my favorite study). But it certainly doesn’t always work, and in some years, it’s almost the inverse of what works.
I can’t tell you what to do with your money, but I personally would not follow the Piotroski Score in a strict plug-and-chug sense with a large portion of my portfolio. I have certainly used it as an idea screener in the past, even though cherry picking from a mechanical strategy is like fingernails on a blackboard to a mechanical investing believer (their whole point is taking human judgment out of the equation). But I do think the amount of evidence the Piotroski Score has generated is worthy of attention, and would consider following a modified version with a modest portion of my equity portfolio.
This article is for informational purposes only and is neither investment advice nor a solicitation to buy or sell securities. All investment involves inherent risks, including the total loss of principal, and past performance is not a guarantee of future results. Always conduct thorough research or consult with a financial expert before making any investment decisions. Neither the author nor BBAE has a position in any investment mentioned.


