
Why the Market Crashed, and What You Should Do
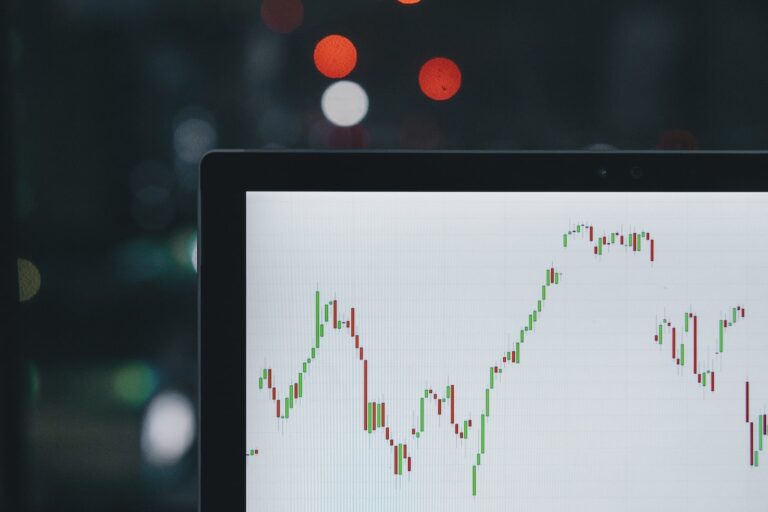
If you either checked your portfolio or consumed any sort of financial news on Monday, August 5th, you noticed that stocks were down. Surprisingly so.
The S&P 500 dropped roughly 3%. The big tech stocks had it worse: Nvidia (Nasdaq: $NVDA) fell 6%, after being down 13% earlier in the day, and Apple (Nasdaq: $AAPL) dropped 4%, after being down as much as 9% – in Apple’s case, partly on news that Warren Buffett’s Berkshire Hathaway had sold half its position.
Abroad, things were even worse: The Japanese stock market, proxied by the Nikkei 225 Index, fell 12.4%, its worst day since Black Monday of 1987. The Taiwanese stock market, otherwise a global darling in 2024, had its worst day ever, with an 8.4% decline.
Why did global markets crash and what, if anything, should investors do?
Put differently: Is this a short-term dip – or is it the beginning of a recession and/or long, rough period for stocks? (And what, if anything, should you do?)
While nobody has a crystal ball, we can unpack a few things.
Precursor: Stocks have been on the pricey side.
We’ve discussed the PE ratio and how it’s not perfect at any time and how for several structural reasons, “modern” stocks may deserve a permanently higher PE ratio. But caveats and all, stocks are far from cheap:
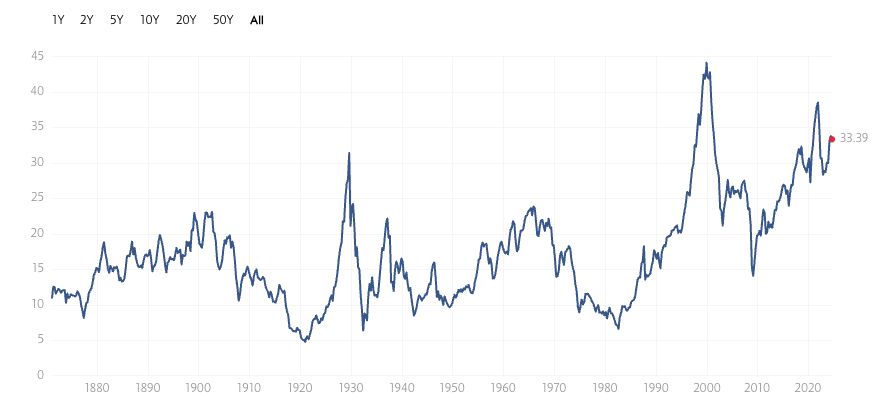
Especially the big tech and semiconductor stocks, which have been riding an AI wave that some would call a bubble.
Main point: We began with a tippy, arguably overvalued market.
One irony noticed by a few analysts and journalists, as well as yours truly, is that multiple explanations for the Monday plunge are making the rounds.
- The Fed is slow to lower rates: This is certainly a factor, in that the market had a smaller dip last week after the Fed’s July 30-31 meeting where Jerome Powell basically just said that a September rate cut might be in the cards (the market had hoped for something more emphatic). But that’s not new news; the market has already digested it. I’d call this a background concern, but not a Monday catalyst.
- US hiring slowed quickly, and manufacturing dropped to an 8-month low: The manufacturing news was from Thursday, August 1st – an eon ago in market time. The unemployment numbers – just 114,000 new jobs created in July, versus estimates of around 180,000, and a big jump to a 4.3% unemployment rate – indeed show a labor market that may be cooling faster than the Fed wants (the Fed wants some cooling). But that, too, was Friday morning’s news. One might claim that Friday morning US time is Friday night, Asia time, so Monday is the earliest that Asian markets can react to this US jobs news. It might be a stretch to attribute the entire Monday swoon to this, though.
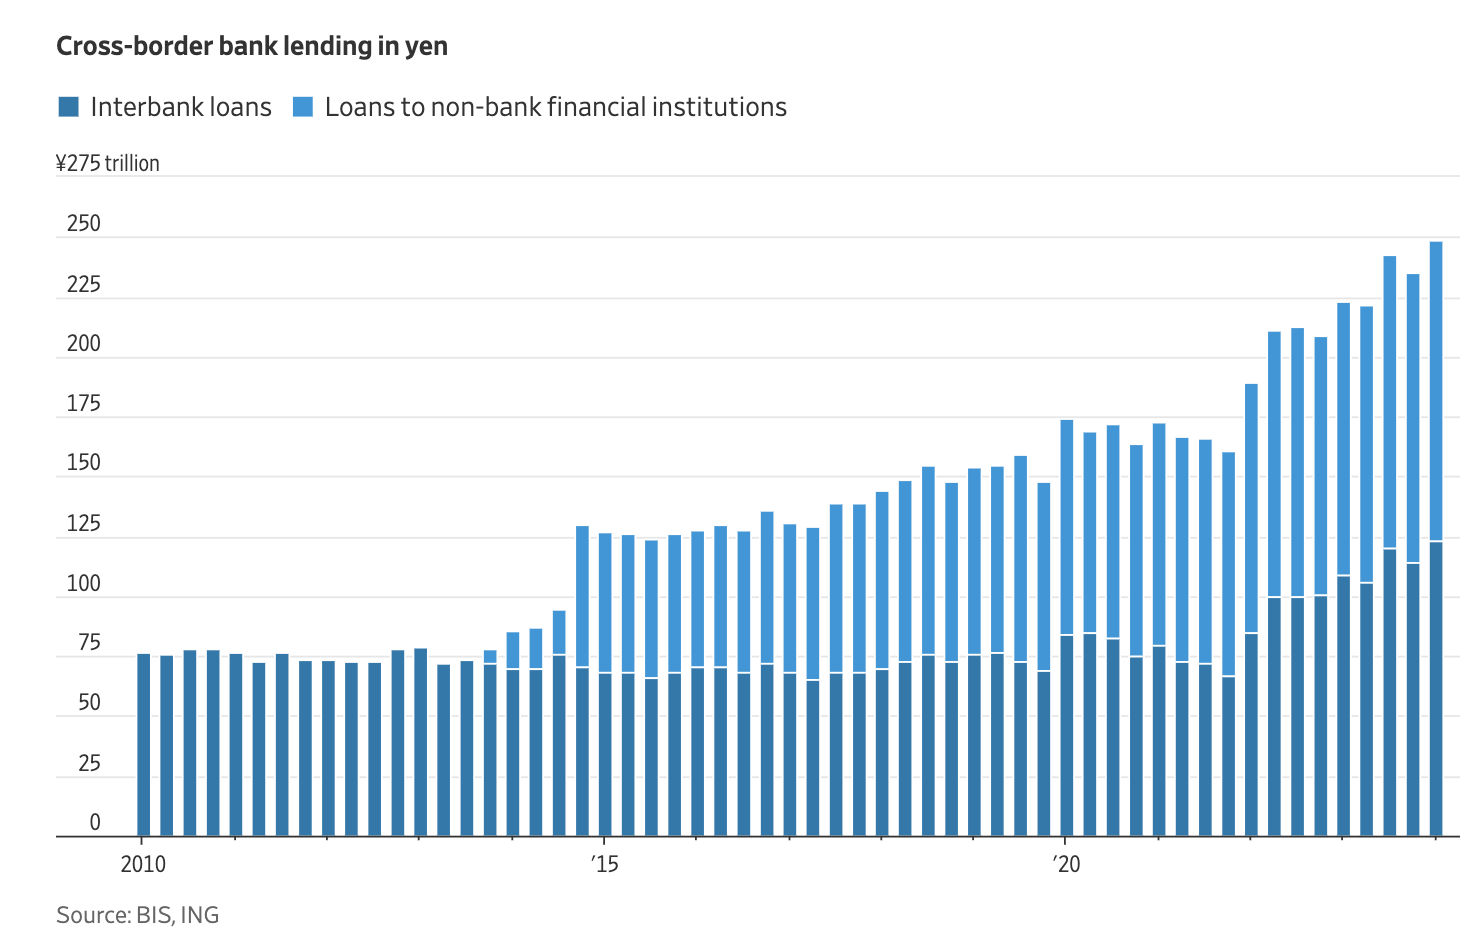
- The carry trade is unwinding because the Bank of Japan hiked interest rates, and this spiked the yen, which hurt the carry trade, which caused institutional investors to dump collateral, and they, in a risk-off mindset, mostly chose high-fliers to dump: There’s a lot to unpack here, but this seems to be at least part of it. The BOJ hiked rates on July 31, so this can’t be an immediate reaction to that alone. The yen did rise on Monday, though (most articles only mention “against the dollar” but my sleuthing showed that the yen rose against just about every major currency on Monday), and that could have been a reaction to the Friday US jobs report. The carry trade is when institutional investors borrow money from a low-rate country – Japan is about as low-rate as it gets – and invest it in (usually) higher–paying bonds in developing or developed markets. One potential perspective is this: If the poor jobs report means US is getting closer to a Fed Funds rate cut than expected, that means at least two things for carry traders:
- US bonds will soon start to pay carry traders a bit less (the Fed does not set US bond rates, but Fed Fund and Treasury rates tend to move together). Plus, Fed aside, worsening employment is scary, and scary news makes investors think of a worsening economy (and maybe even a recession), and scared investors flee from stocks and into bonds (especially super-safe US government bonds), and higher prices mathematically push bond yields down. In fact, US Treasuries hit their lowest level in more than a year on Monday.
- Foreign investors may get less interested in lower-yielding US bonds, and more interested in now-higher-yielding Japanese bonds instead: The counterbalancing force here is that the US is the flight-to-quality destination (i.e., fearmongers who said the US dollar would implode after the US lowered rates following the 2008-2009 financial crisis were proven wrong), but generally, higher rates mean a stronger currency (because foreign investors want those bonds more, and must “buy” them by first converting their native currency to the bond-country currency, thus creating currency demand). A more expensive yen may sound good (and is good for Japanese tourists traveling abroad) but it’s bad for an export-heavy economy because it hurts sales.
Anyway, if you borrowed in yen, converted to dollars, then bought whatever investments with those dollars, you owe yen. And if the yen-to-dollar rate moves against you, you owe more yen. You may decide to close out your position (which only makes the yen pricier), and if you need some extra liquidity to do that, you may choose to sell some high-flying investments that you suspected were a little overpriced already.
This explanation is a mouthful, and the timing is slightly longer than one might expect after the BOJ rate hike, but it makes sense.
Per a graphic in the Wall Street Journal, there’s a lot of money parked in these trades, too, so this could be a big unwind.
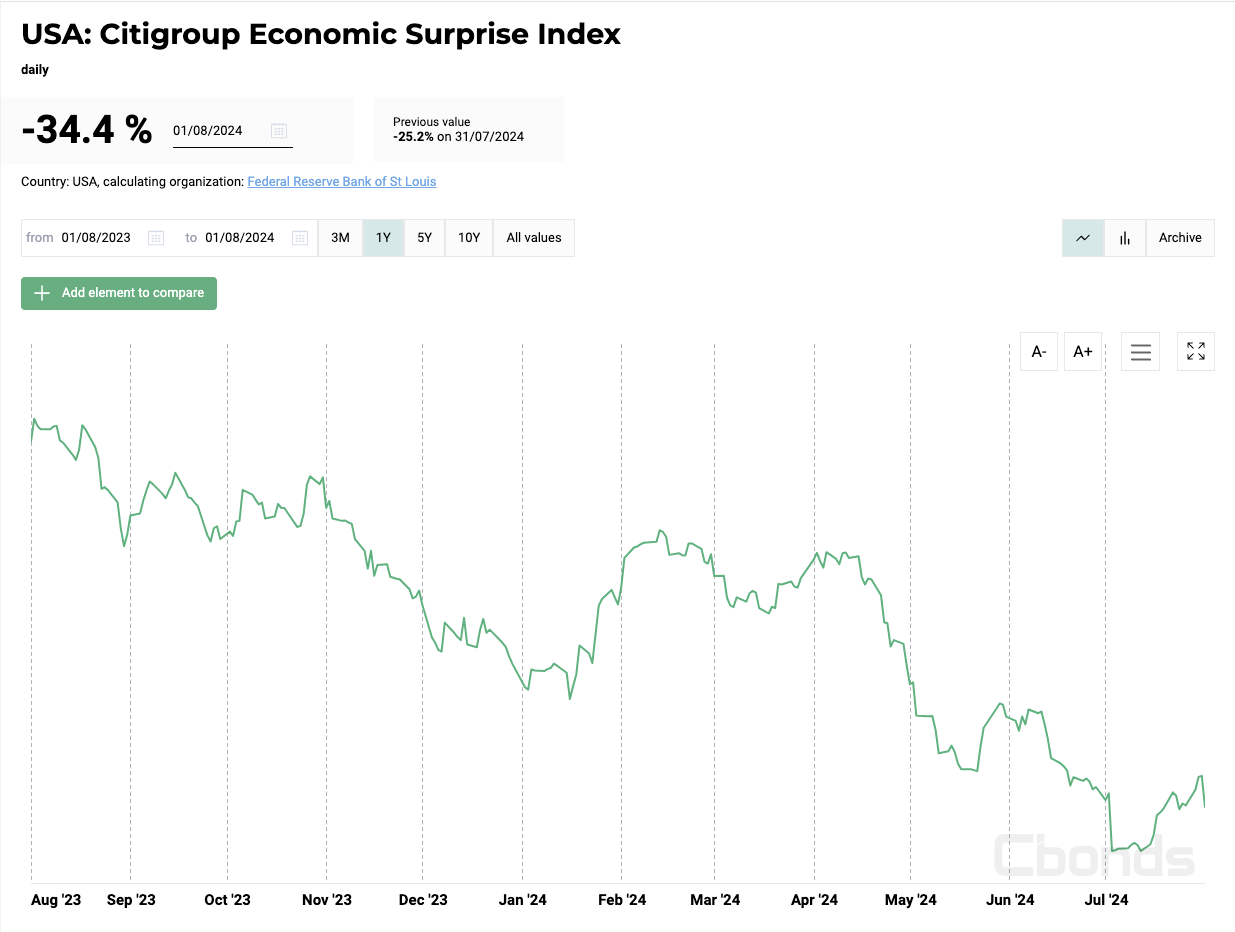
- Earnings worries/weak consumer spending: McDonald’s (NYSE: $MCD) reported falling global sales for the first time in three years, and Intel’s (Nasdaq: $INTC) results were terrible. Generally, corporate profits have held up, but consumer spending is slowing in the US (and in China, too, for that matter). This, too, is at best a background reason, even if, generally, economic surprises have been trending negative, per the Citigroup Economic Surprise Index:
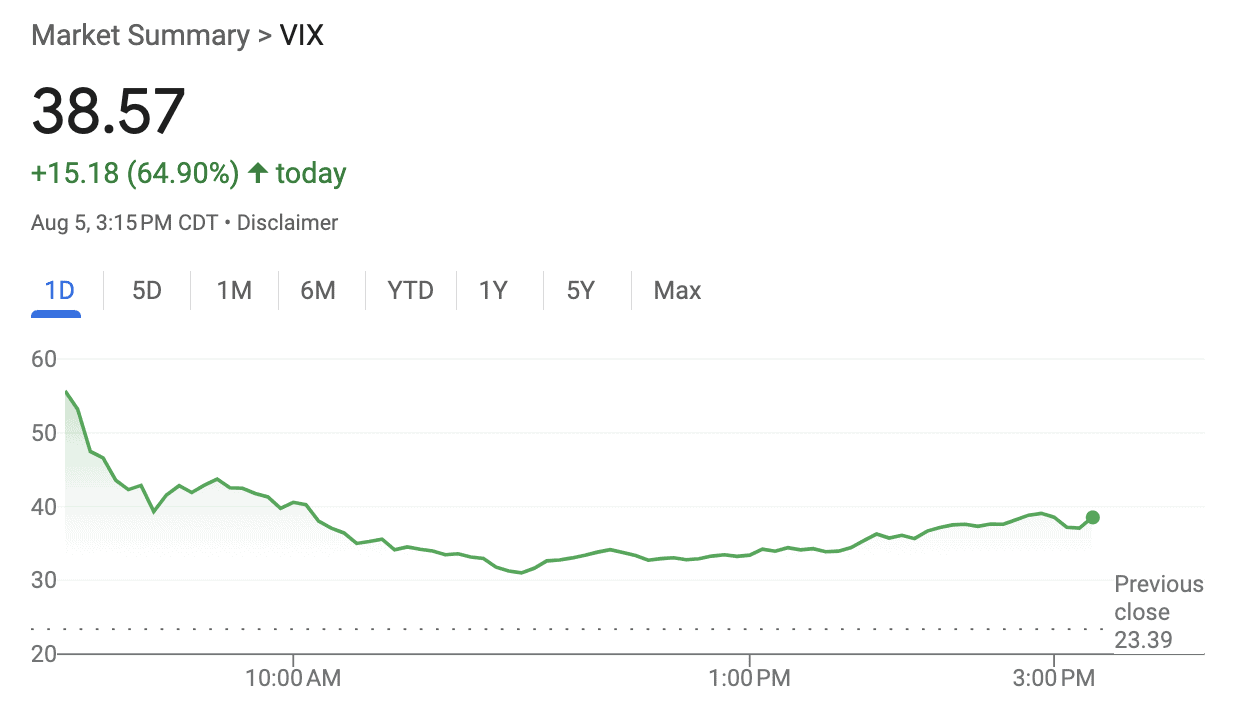
- Investors had to get out of volatility trades: The VIX (a symbol for the CBOE Volatility Index) spiked today. Volatility might not spike by itself – i.e., this was likely a reaction to other things – but a spiking VIX may itself have been a significant enough force that it caused other reactions. In fact, the VIX had its biggest one-day spike since 1990.
On top of these five factors, it’s plausible that when things look spooky, investors sell the most overpriced-looking stuff first, and that’s big tech.
Interestingly, gold – normally a safe haven perfect for days like Monday – dropped as well.
What happens next?
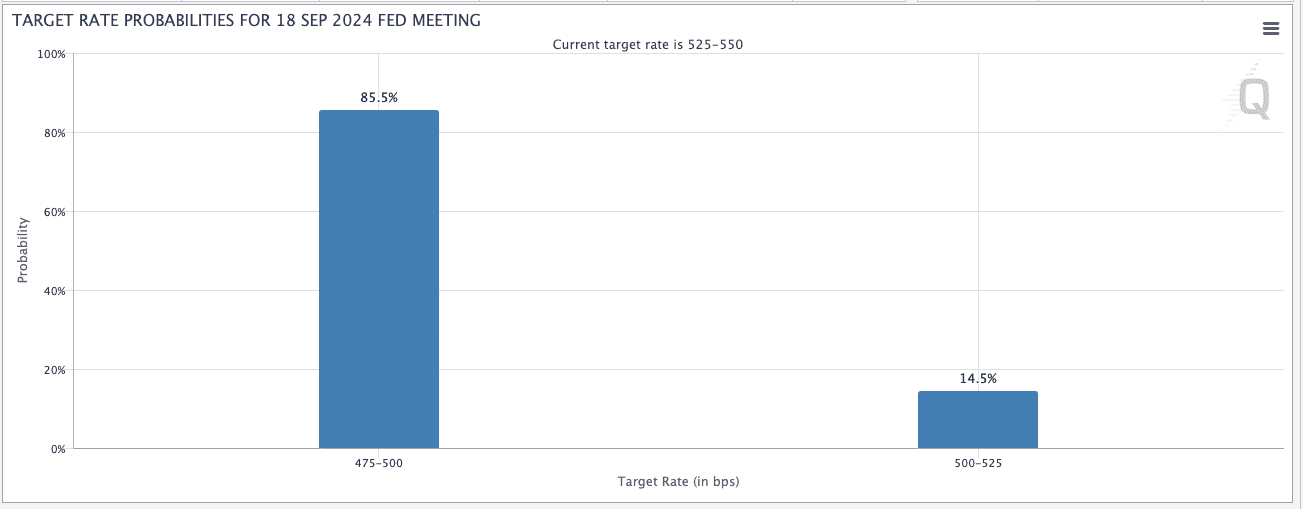
The next Federal Reserve Open Market Committee (FOMC) meeting, where Fed Funds rate adjustments are usually made, is September 18. According to the CME FedWatch tool, a rate cut of up to 75 basis points is very likely (85.5% probability at the time of the screenshot):
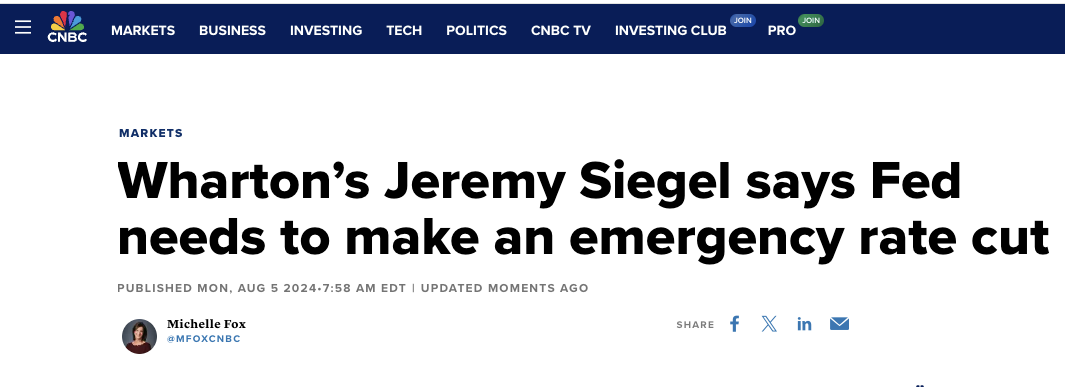
Wharton professor Jeremy Siegal says that’s not enough, and that the Fed needs to huddle to make an emergency 75-basis point rate cut.
The Fed isn’t officially chartered with minding the stock market – just employment and inflation – but it no doubt keeps market conditions in mind when setting policy.
The big question the Fed is likely pondering is whether this drop is a one-off (or at least part of a short-term spell), or whether it could represent the start of a recession or bear market.
I don’t think – and I believe the Fed would agree with me on this – there’s robust data to show that the US economy is doing badly. It’s not, even if it is weakening a bit more suddenly than expected following the Fed’s higher-for-longer policy.
Speaking of robust data, there’s plenty showing that markets bounce back:
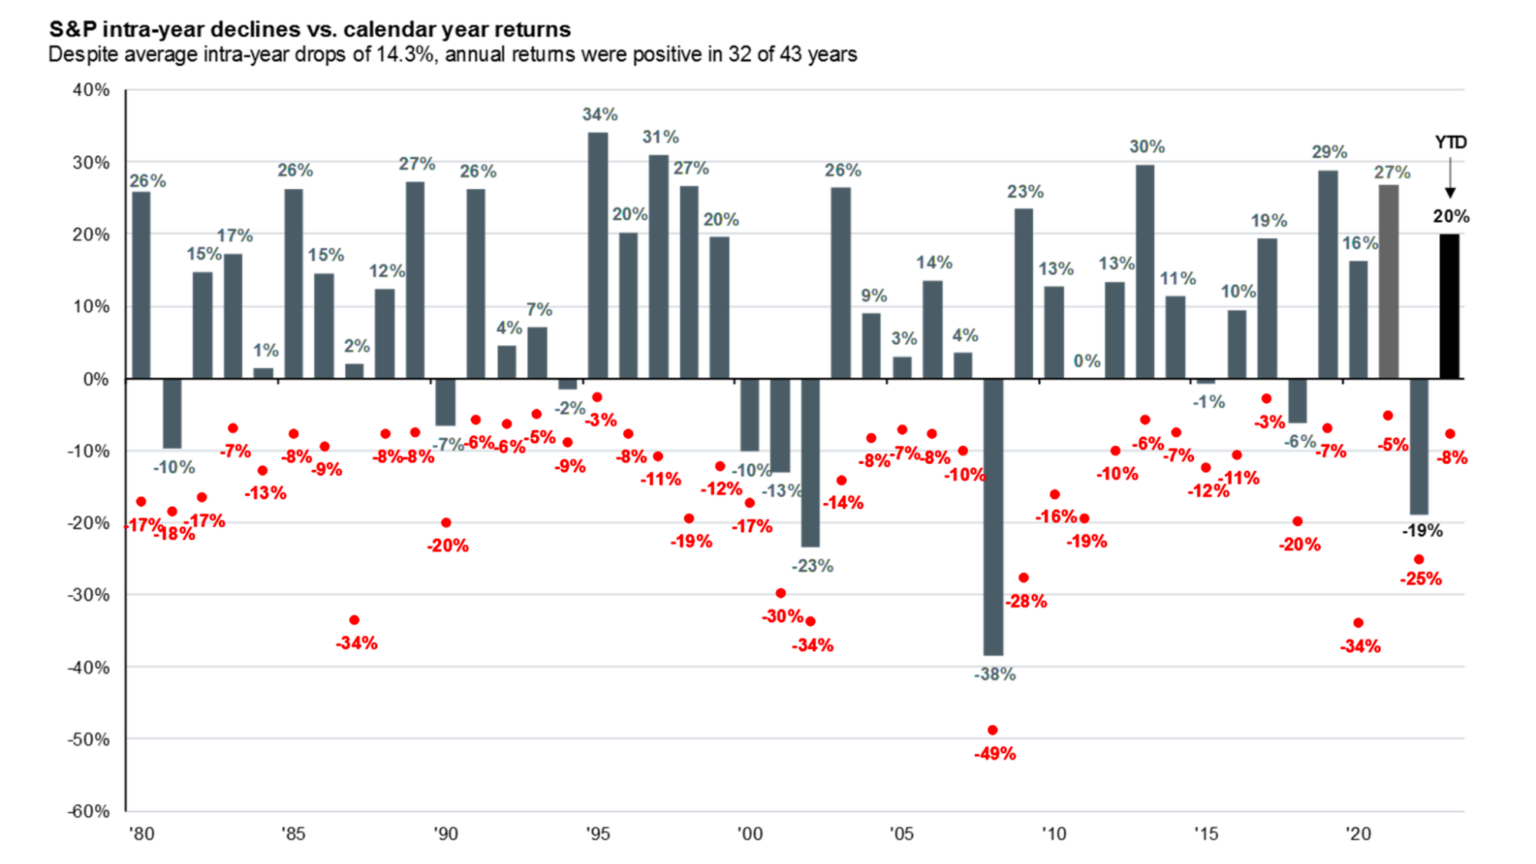
- Big drops tend to be recovered from quickly (part 1)
JP Morgan Asset Management showed that most of the time, even in years with serious drops, the S&P 500 still ended up positive for the year:
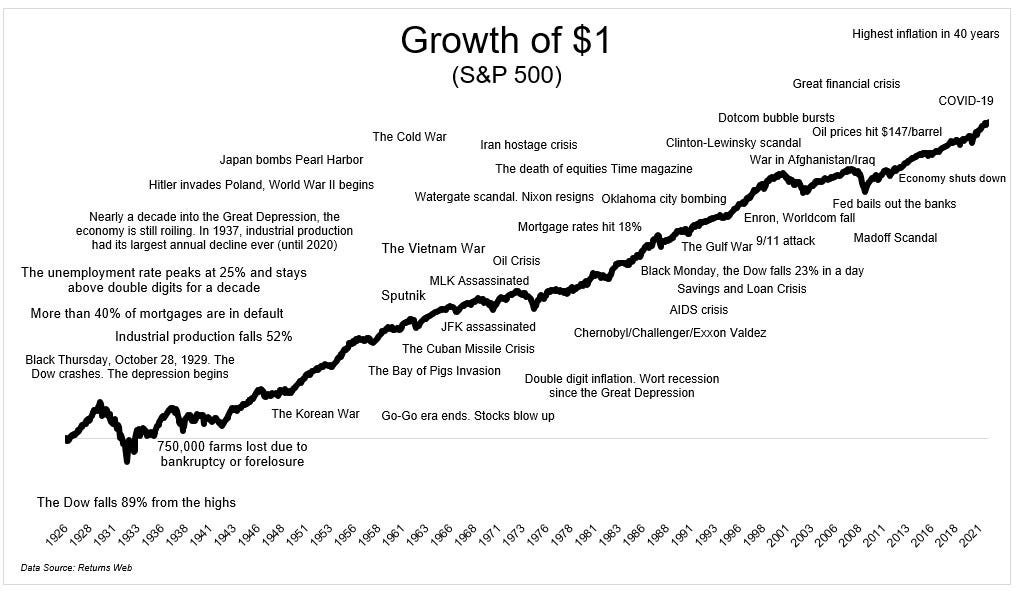
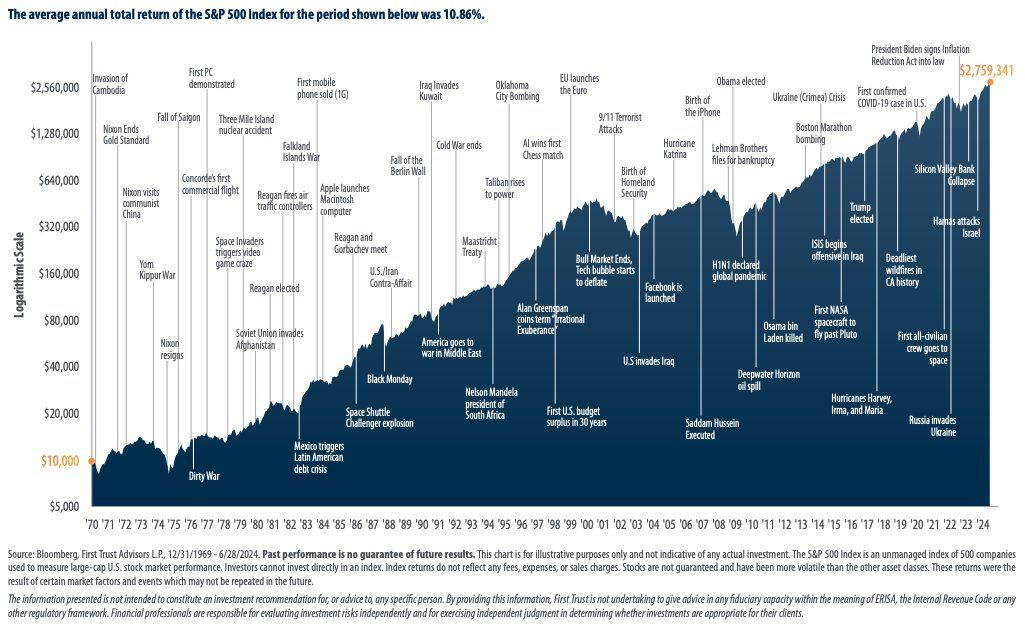
- Big drops tend to be recovered from quickly (part 2)
And while I couldn’t find sources (aside from “Returns Web” mentioned on one of the charts (apparently it’s owned by Dimensional Fund Advisors but one can’t get far on the website) and First Trust on another, though it’s not clear if these are the primary sources), there are multiple graphs like the two below circling around the internet. They tell the same story: Despite cataclysms, wars, panics, crises, and the like, the US stock market has done a pretty miraculous job of going up over time:
I’m not worried (yet)
I can’t tell you what to do, but I can tell you that I’m not worried at this point. I tend to believe, like many, that stocks (especially tech stocks) got ahead of themselves, and we’re seeing things come down a bit. But that’s quite different from a long-term panic.
It may have arguably even been a good thing – if accidentally good – that many brokerage websites were down today, as demand overwhelmed servers. (BBAE’s, for the record, was fully functional all day.)
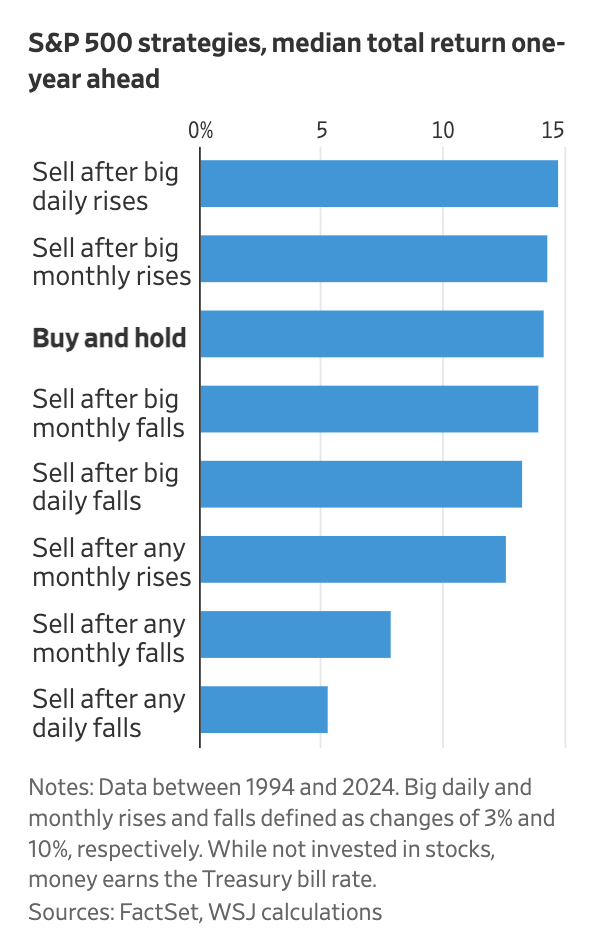
A Wall Street Journal graphic conveys the wisdom of sitting tight, versus trying to react after big movements:
As Warren Buffet said in 2015 (a quote recently flagged by CNBC):
“If you’re worried about a market correction, you shouldn’t own stocks.”
So true.
This article is for informational purposes only and is neither investment advice nor a solicitation to buy or sell securities. All investment involves inherent risks, including the total loss of principal, and past performance is not a guarantee of future results. Always conduct thorough research or consult with a financial expert before making any investment decisions. Neither the author nor BBAE has a position in any investment mentioned.